Phenotype Information for 005314
TALLYHO/JngJ
TALLYHO/JngJ males develop diabetes when maintained on standard mouse chow (6% fat, w/w). Features of this emerging polygenic model of type 2 diabetes include:
- Diabetes without the severe weight gain of db/db or ob/ob mutant mice (Figure 1)
- Non-fasting hyperglycemia (Figure 2)
- Glucose intolerance by 8 weeks (Figure 3). Similar results were obtained at 16 and 24 weeks.
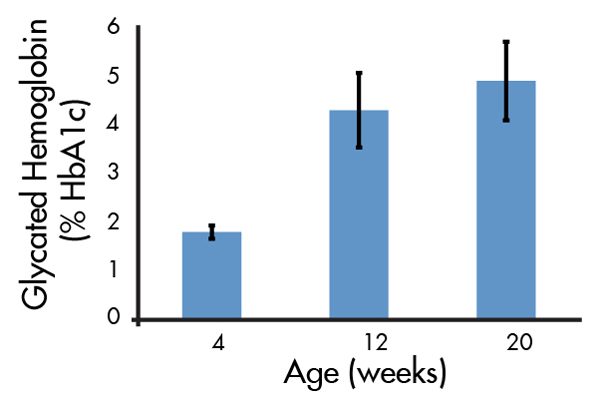
- Glycated hemoglobin (% HbA1c), a stable marker for blood glucose levels, that increases with age (Figure 4)
Blood glucose measurements were obtained using a OneTouch® Ultra hand-held glucometer. For the glucose tolerance tests, mice were fasted 14-16 hours and glucose was administered by oral gavage at 2g/kg body weight. Blood glucose was measured in 30 min intervals.
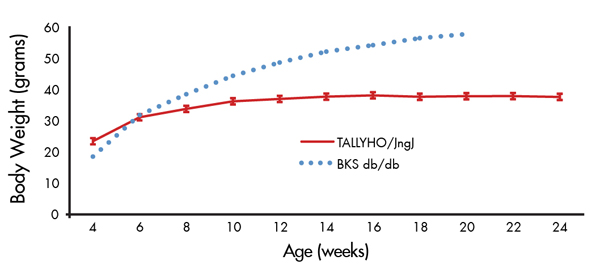
Figure 1. Modest weight gain of TALLYHO/JngJ mice. Biweekly body weights of TALLYHO/JngJ males. Data represent mean values and standard deviations of 20 mice. As a reference, the mean body weights from BKS db/db mice (BKS.Cg-Dock7m +/+ Leprdb/J, Stock No. 000642) are included from a separate study.
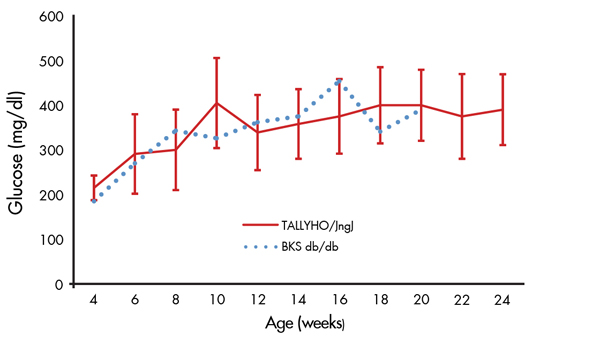
Figure 2. Elevated non-fasting blood glucose in TALLYHO/JngJ mice. Biweekly non-fasting blood glucose values of male TALLYHO/JngJ mice. Data represent mean values and standard deviations of 20 mice. As a reference, mean blood glucose values of BKS db/db mice (BKS.Cg-Dock7m +/+ Leprdb/J, Stock No. 000642) are included from a separate survey.
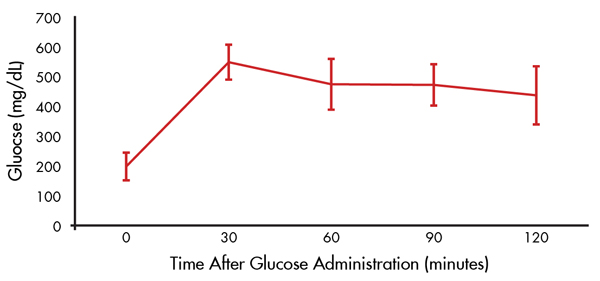
Figure 3. Glucose intolerance by 8 weeks of age. Oral glucose tolerance test (OGTT) of 8 week old TALLYHO/JngJ males. Data represent mean values and standard deviations of 10 mice.